One operating picture instead of scattered tables and status messages
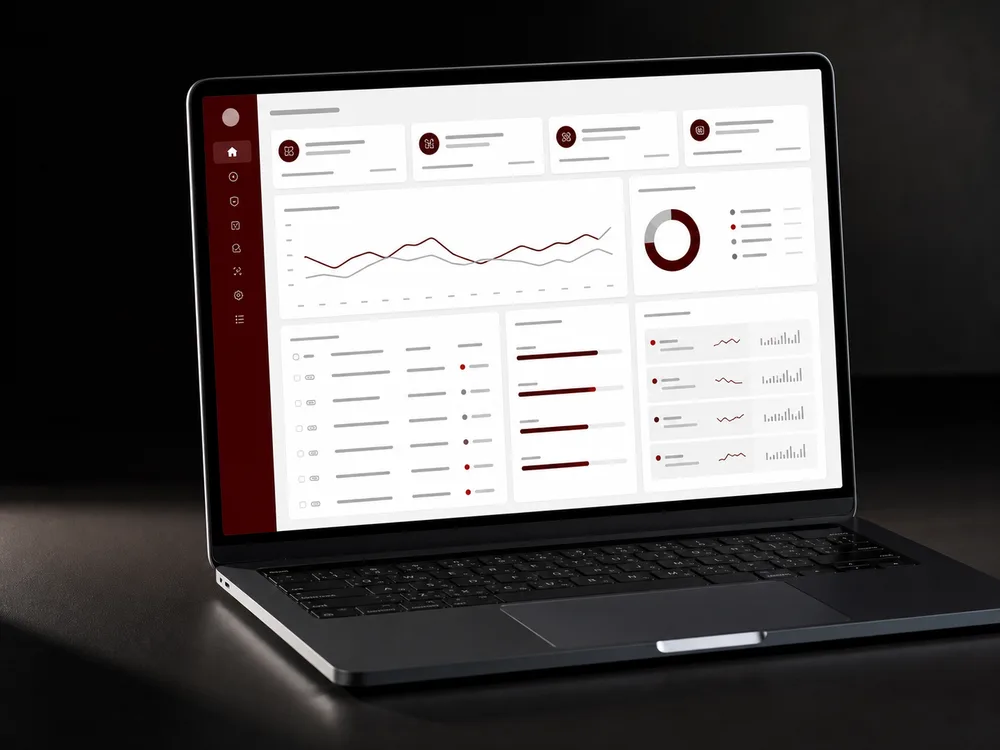
Growth made the existing process difficult to see and control
Requests arrived through several channels, planning lived in separate spreadsheets, and managers had to assemble the current situation manually. The goal was not another dashboard, but a shared operating process that the team could actually use every day.
- Users
- Management, coordinators, specialists
- Core object
- Request from intake to completion
- Main constraint
- Launch without stopping current work
The company had data, but no single reliable state of work
The problem was not a lack of tools. It was the absence of one agreed flow and clear ownership between the tools already in use.
- 01
The same request was copied between messages, spreadsheets, and personal notes.
- 02
Resource planning depended on manual checks and the experience of individual coordinators.
- 03
Management received the picture after delays, when part of the information was already outdated.
The system was designed around decisions, not around a list of features
The first version concentrated on three connected parts that could replace the fragmented process without forcing the team to learn an oversized platform.
Unified intake
Every request enters one queue with the required context, priority, owner, and next action.
Planning and responsibility
The team sees workload, dependencies, deadlines, and the person responsible for moving each item forward.
Management visibility
Leaders see the current state, risks, and bottlenecks without collecting a separate report.
I kept the business process and the technical implementation in one picture
The role covered the path from understanding the current work to launching the first usable version and observing how it behaved in practice.
- Interviews and mapping the existing process
- Defining the first release and decision boundaries
- Data model, permissions, and integration design
- Implementation, release, feedback, and next iteration
The system entered real work in controlled stages
- 01
Observe
Document the actual flow, exceptions, and decisions before changing the process.
- 02
Build the core
Create the shortest complete path from a new request to a visible result.
- 03
Pilot
Run the new flow with a limited group and correct friction while the context is still fresh.
- 04
Expand
Add integrations and management views after the operational core becomes stable.
The main change was a shared operating state, not another reporting layer
One source of work
Requests and their current status are visible in one process instead of several parallel records.
Clear next action
Each active item has an owner, a current state, and an explicit next step.
Earlier visibility
Risks and overload become visible during the work, not only in a retrospective report.
This page is a demonstration template. Quantitative results will be added only when a real project and publishable evidence are selected.
Release begins the observation phase
The first weeks are used to compare the designed process with real behaviour, remove unnecessary steps, clarify permissions, and decide which integrations create the most value next.
Let’s start with how the work happens today
You do not need a finished technical brief. A description of the current process and its main bottleneck is enough for a first conversation.